Bait station and trap monitoring
Walk the route. Scan the station. Three taps and you are at the next one.
An offline log for bait stations, snap traps, multi-catch, insect light traps, pheromone traps and glue boards. The scanner stays open throughout the round, so nothing waits on a save dialog or a bar of signal.

- 50 to 300 devices a site
- Works with no signal
- No account
The arithmetic
Seconds at every stop become minutes across the route.
A route is 50 to 300 numbered devices, and every one of them is a stop. Ten seconds of friction per device is eight more minutes on a fifty-device site and fifty more on a three-hundred-device one. That is the whole design brief: a monitoring app that slows the technician down loses to the paper route sheet it is meant to replace, however good its reports are.
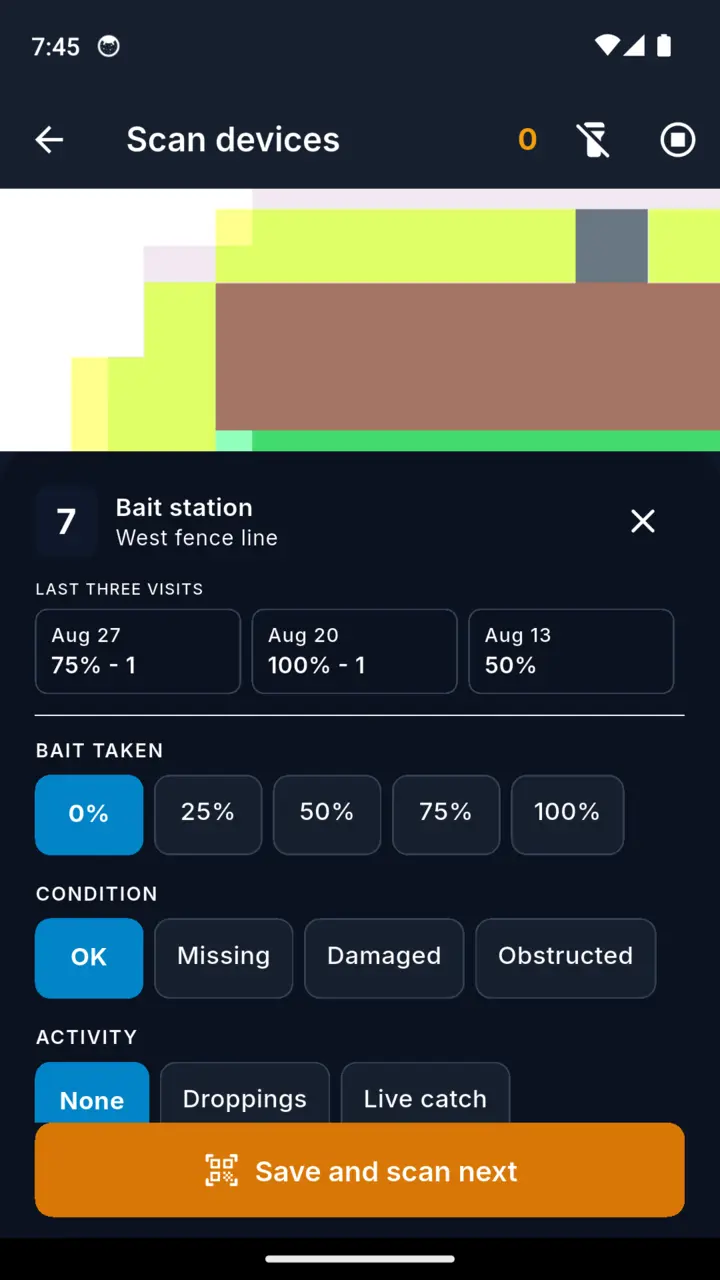
Scan a station tag and the device opens with its identity and its last three visits. Bait taken, condition and activity are one tap each. There is no save dialog and no confirmation step, and the scanner is held open for the whole round rather than being torn down and rebuilt at every device.
- Bait station
- Snap trap
- Multi-catch
- Insect light trap
- Pheromone trap
- Glue board
Offline by construction
Nothing in the loop waits on a network.
Exterior perimeters, grain tunnels and cold stores are not places you can count on a bar of signal. Everything is written to the phone as you go, and there is no account to create and no sign-in to lose on the morning of a visit.
- No sign-in, no password reset in a loading dock
- No server, no sync conflict, no "retry" state
- Your records stay on the device
The grading rule
One grading rule across every round.
Every reading is graded the same way every time, tested in the order below, so the bands cannot overlap. There is no fifth grade and no hidden weighting. What two technicians observe can still differ; how the app grades what they wrote down does not.
Clear
Nothing taken, nothing seen
The device was reached and there was nothing to record.
Low
Droppings or insects seen, or bait taken below 25%
Evidence without a catch. This is the column that moves first.
Moderate
Bait taken from 25% up to, but not including, all of it
Enough consumption to be worth watching on the next round.
Hotspot
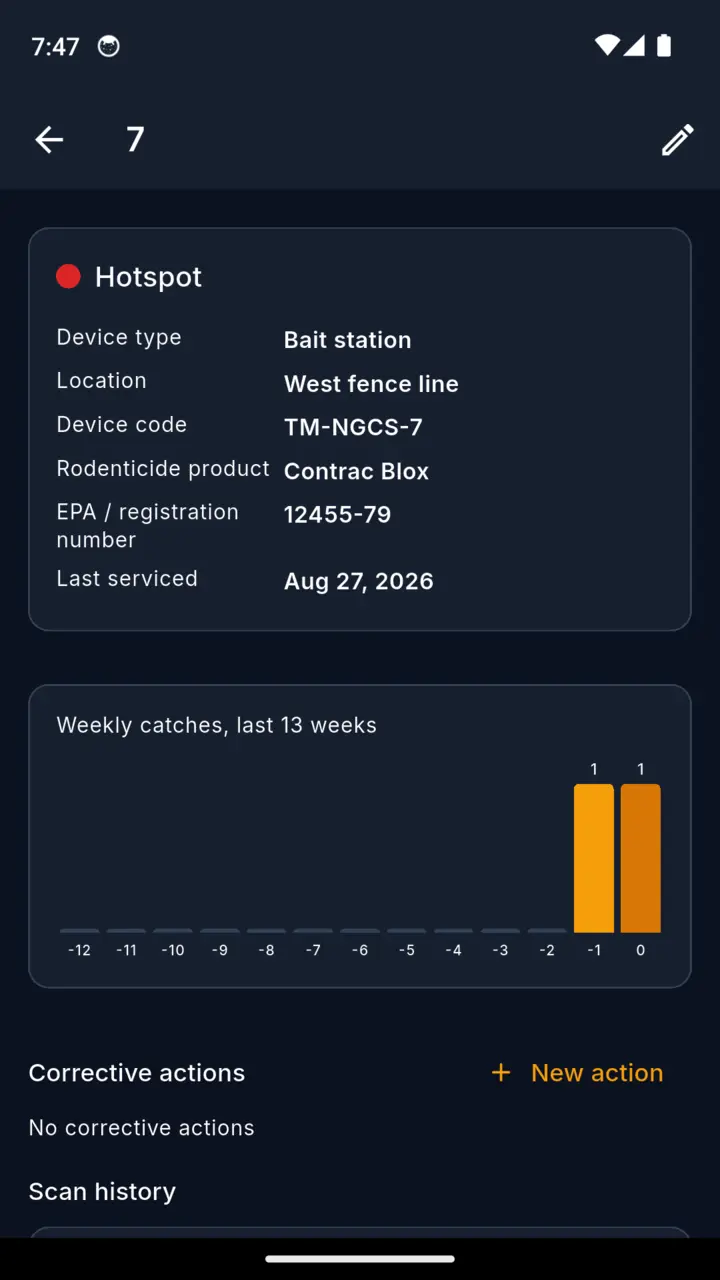
Bait fully taken, or any catch
Tested first, so a full charge is never also read as moderate.
A catch is its own field rather than a number, so one recorded with the counter left at zero still grades as a hotspot. And insects are the expected measurement on an insect light trap, a pheromone trap or a glue board, so on those three they are recorded and trended without grading as a hotspot. A rodent, a fault, or bait actually taken still does.
The site at a glance
An untouched perimeter cannot read as a clean one.
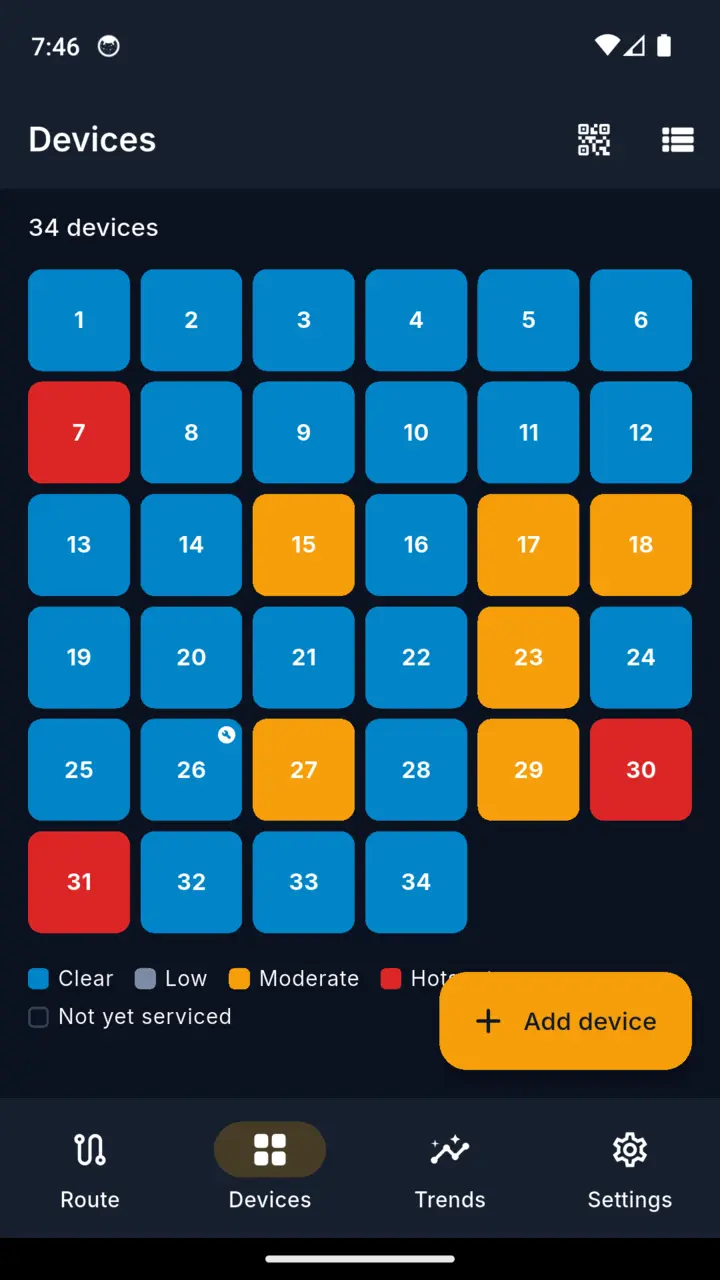
The facility grid colours every device by the activity last recorded against it, grouped by the location you assigned: exterior perimeter, interior line, dock, roof or production.
A device that has never been scanned is drawn hollow rather than clear. The difference between "we checked it and there was nothing" and "nobody has been there" is the difference a monitoring record exists to carry.
30, 60 and 90 days
Compare devices across unequal monitoring periods.
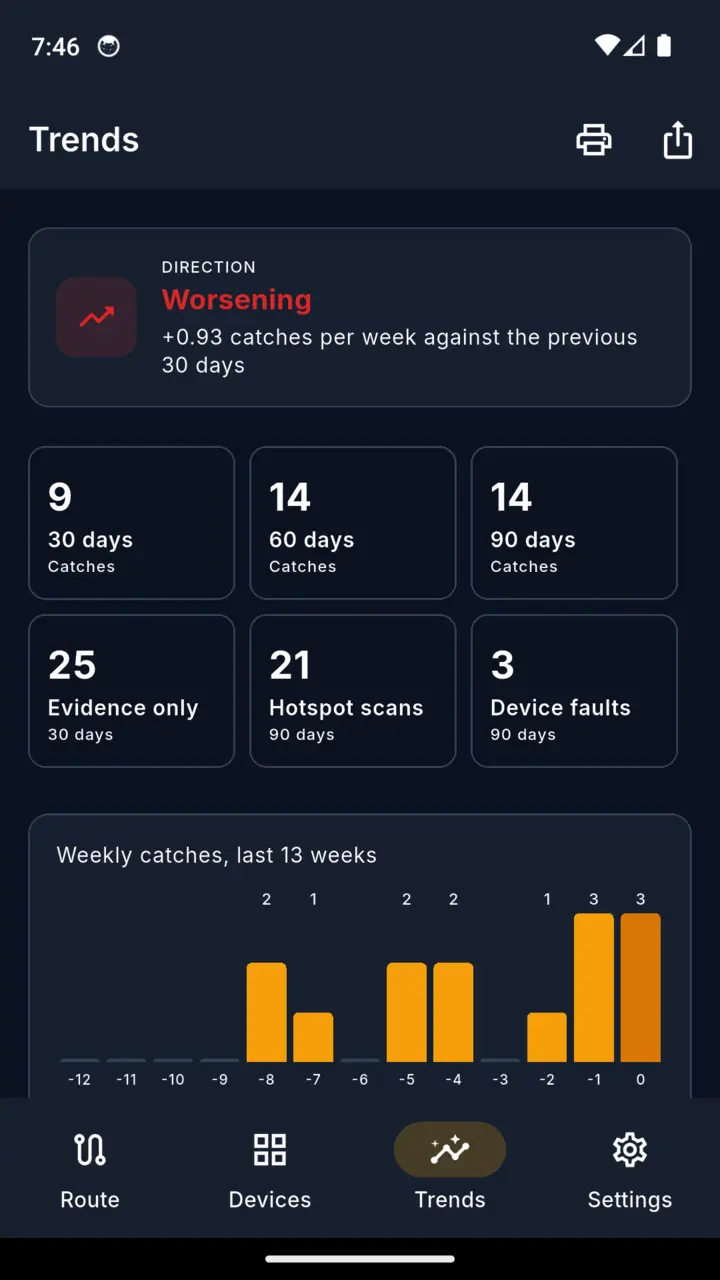
The 30, 60 and 90 day windows are counts. The direction arrow is one comparison: the last 30 days against the 30 before them, so one bad round does not read as a trend. It is not computed for the 60 and 90 day windows.
Devices are ranked by activity per week of observation. Activity here is catches plus the scans that graded hotspot; the weeks are measured from a device's first scan in the window to its last. A count read after thirty days is not comparable with one read after seven just because each of them was one scan.
Per visit
Monthly device: 2 catches, 2 scans
Weekly device: 2 catches, 2 scans
Reads as identical
Per week of exposure
Monthly device: 2 catches over 28 days
Weekly device: 2 catches over 7 days
The weekly one is four times worse
Findings
Routine catches stay separate from findings.
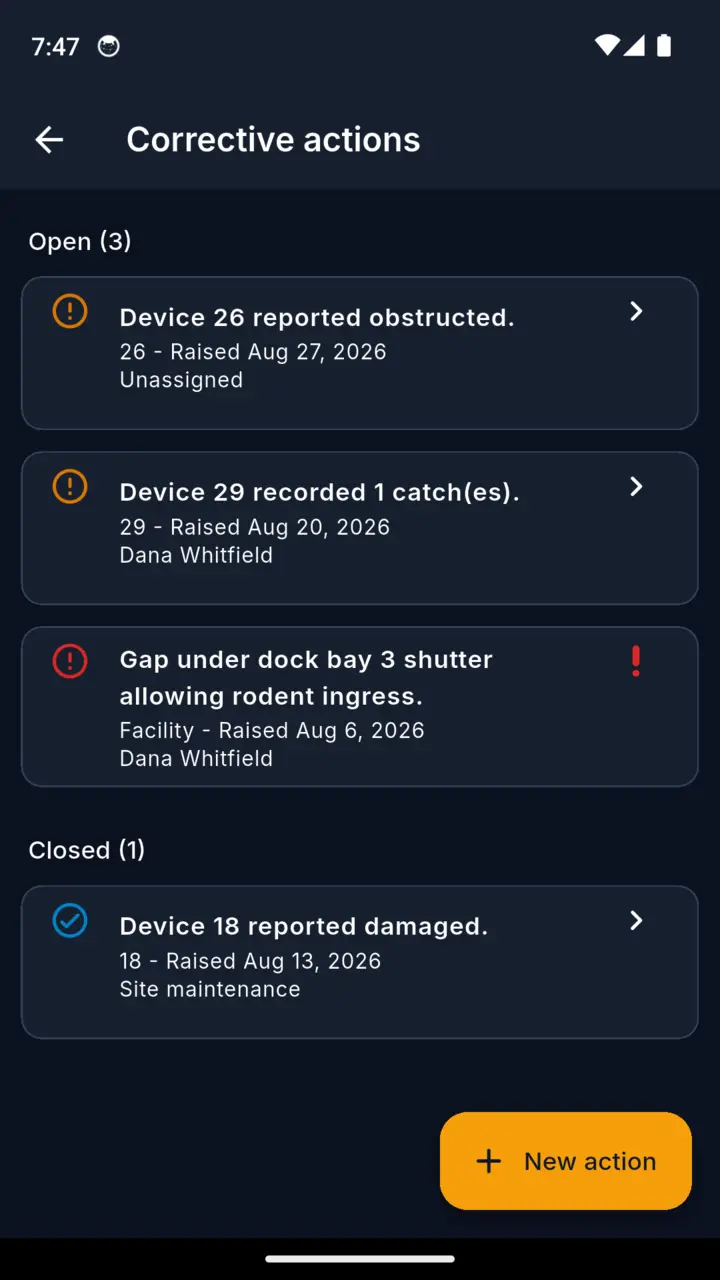
A device fault, a fully taken bait charge, or a catch on a device that is not there to catch opens an action for you to review. Give it an owner and a due date, and close it out with a photo.
Opens an action
- A device that cannot be found, is damaged or is obstructed
- Bait fully taken
- A rodent on any device
- A catch on a bait station
Does not
- Insects in an insect light trap
- Insects on a pheromone trap
- Insects on a glue board
Those three devices exist to catch insects. Raising a finding every time one works would bury the real ones under routine noise on every round.
You decide what a finding means against your own thresholds. The app's job is to make sure it is not lost between the round and the paperwork.
Numbering a new site
Print your own QR and barcode tags.
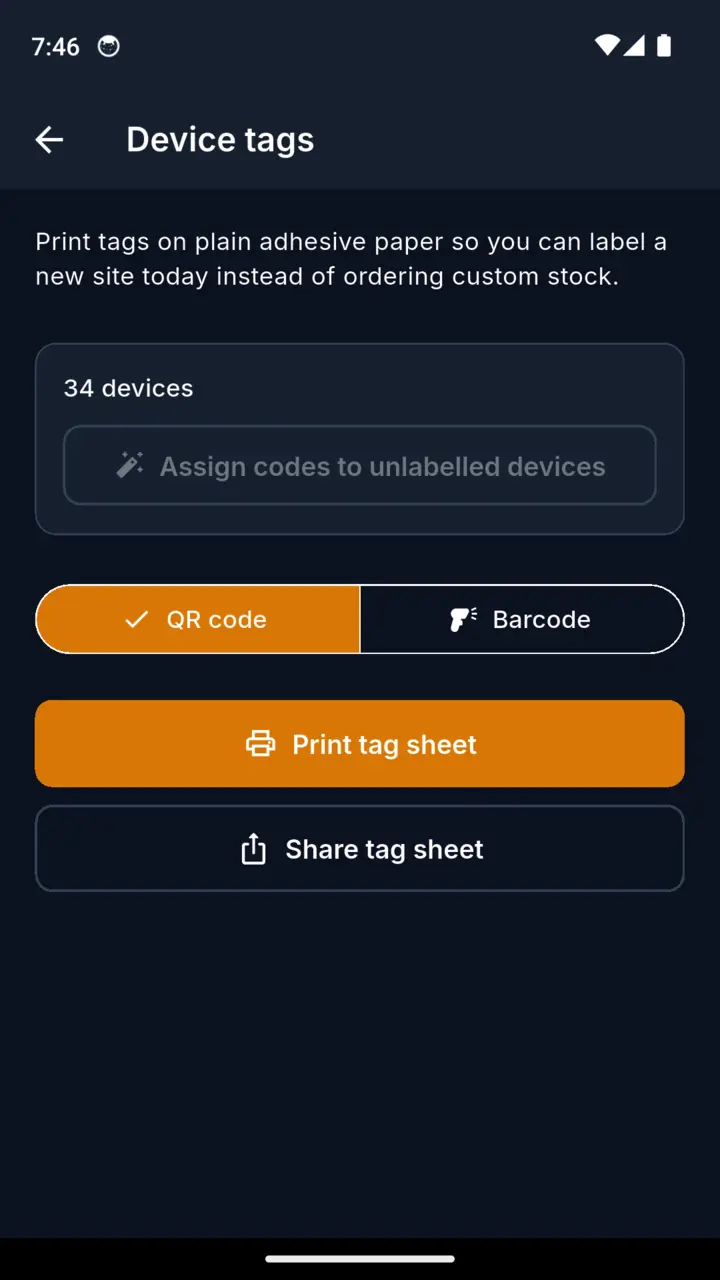
QR or Code 128 tag sheets, laid out for plain adhesive stock, so a site can be numbered and labelled the day you win it instead of the week the custom labels arrive.
Missing barcodes can be assigned across a whole site at once, and a code that clashes with an existing device is caught rather than silently duplicated.
The monitoring report
One monitoring PDF for the site record.
Generated in a background isolate, so the app stays responsive on a phone that is also holding a route.
- 01 Device status summary Counts by grade for the period, and the devices never reached.
- 02 Pest activity trend The 30, 60 and 90 day series and the direction against the previous 30 days.
- 03 Device status matrix Every device, its location, its last reading and its grade.
- 04 Corrective action log What was raised, who owned it, when it was due and how it closed.
- 05 Product register The product identifiers and registration numbers you entered against devices, with device counts. Entered information, not a validated registration.
- 06 Visit history Each visit, and how many devices it reached out of the count at that time.
- 07 Technician declaration The details and signature the technician entered themselves.
It is the monitoring record you hand to an auditor. It is not an audit, TrapMatrix certifies nothing, and the product details it prints are the ones you entered rather than a registration it has checked.
The schedule, and the gaps in it
See exactly how much of the route was covered.
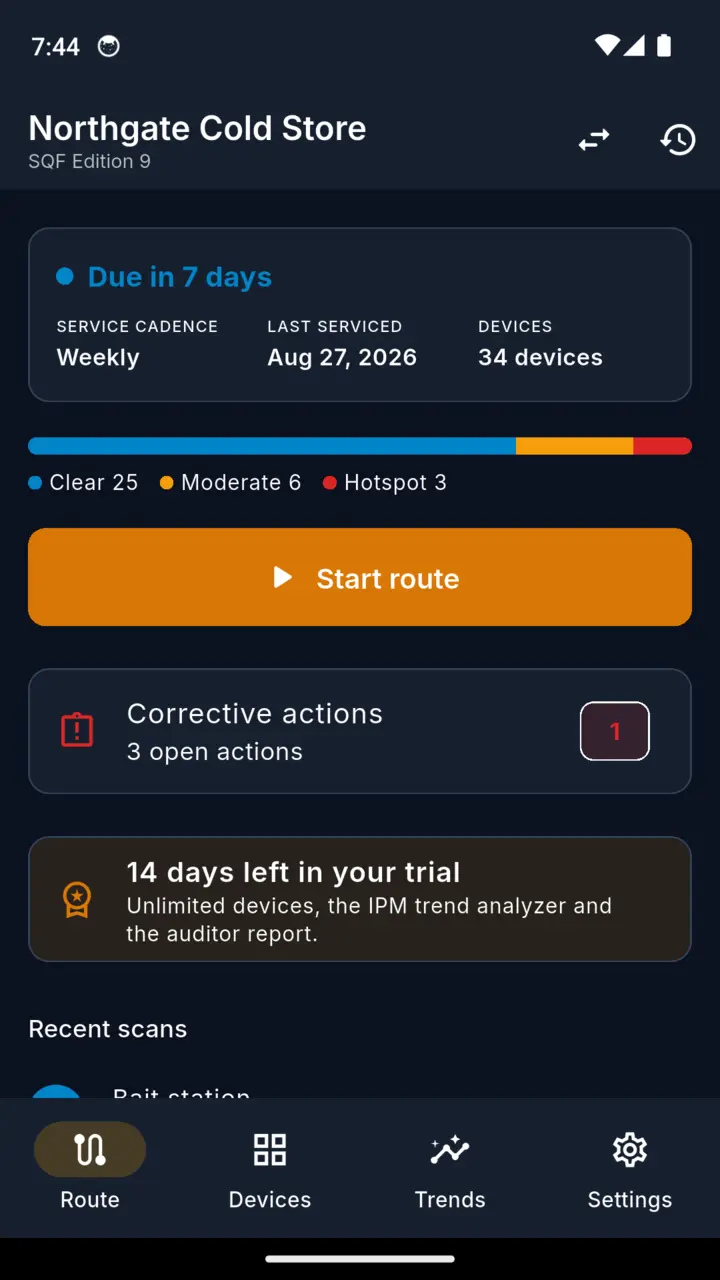
Each visit records how many devices it reached against the device count at that time, so adding devices to a site later never rewrites the result of a past visit. Coverage is on the record next to the readings rather than left to be inferred from them.
Set each site to weekly, fortnightly or every 30 days. These are scheduling choices in the app, not compliance frequencies. "Due soon" is a fifth of the interval, so a weekly route warns with a day and a half in hand and a 30-day one with six days; a fixed seven-day warning would leave every weekly route permanently in the warning state.
The real screens
Captured from the shipping build.
Who it is for
The person whose name is on the record.
Independent pest control operators
Servicing food and warehouse accounts, where the monitoring record is part of what the customer is buying.
In-house QA and food safety officers
The people who face the auditor and have to produce months of history, not last Tuesday's sheet.
Food facilities under a programme
For pest-monitoring records kept by sites operating under FSMA preventive controls, SQF, BRCGS or AIB International requirements. TrapMatrix keeps the record; it does not make a site compliant.
Price
One price for the whole thing.
$4.99
a month
$39.99
a year
$99.99
once
A 14-day trial, no card and no account, and it only starts when you tap. The standard tier holds 25 devices and one site. Nothing you have already recorded is ever locked or deleted: the caps apply to adding devices and sites, and the trends and the monitoring PDF are the Pro features.
Questions
Before you put it on a live route.
Does TrapMatrix work without a signal?
Yes. Nothing in the scan loop waits on a network, and everything is written to the phone as you go. There is no account to create and no sign-in to lose.
Which device types does it cover?
Bait stations, snap traps, multi-catch, insect light traps, pheromone traps and glue boards.
Do I need special barcode labels?
No. The app prints QR or Code 128 tag sheets onto ordinary adhesive paper, and will assign missing barcodes across a whole site at once. A code that clashes with an existing device is caught rather than silently duplicated.
Can I use TrapMatrix for food site pest control records?
That is what it is built for. It keeps the device-by-device monitoring record that food facilities operating under programmes such as FSMA preventive controls, SQF, BRCGS or AIB International requirements are expected to hold. TrapMatrix keeps the record; it does not make a site compliant.
Can TrapMatrix export pest monitoring reports to PDF?
Yes. One PDF per site and period, holding the device status summary and matrix, the activity trend, the corrective action log, the product register, the visit history and the technician declaration. It is built on the phone and shared from there.
Is the PDF an audit?
No. It is the monitoring record you hand to an auditor. TrapMatrix does not certify anything and gives no pesticide application advice.
Where is my data kept?
On your device. There is no server and no account.
Number the site today.
Print the tags on plain paper, walk the perimeter, and the first round is on the record before you leave.