PORTFOLIO RECORD

WealthLog
Your portfolio. Private. Offline.
A ledger, not an adviser.
WealthLog records what you hold, what it cost and what you last valued it at. It has no opinion about any of it — no recommendations, no forecasts, no score out of ten. The app describes itself in one line on its own settings screen: a manual record-keeping tool, not financial advice.

14-day trial, no card.
From $1.99/month. Android.
Record-keeping only. WealthLog does not provide investment advice or recommendations. Every value in it is one you entered, and you are responsible for the accuracy of your own data. Nothing in the app or on this page is a suggestion to buy, sell or hold anything.
Two currencies, never one number
Most trackers ask for a base currency and quietly convert everything into it at today's rate, which turns a stable holding into a moving one and buries an exchange rate inside a figure that looks like your savings.
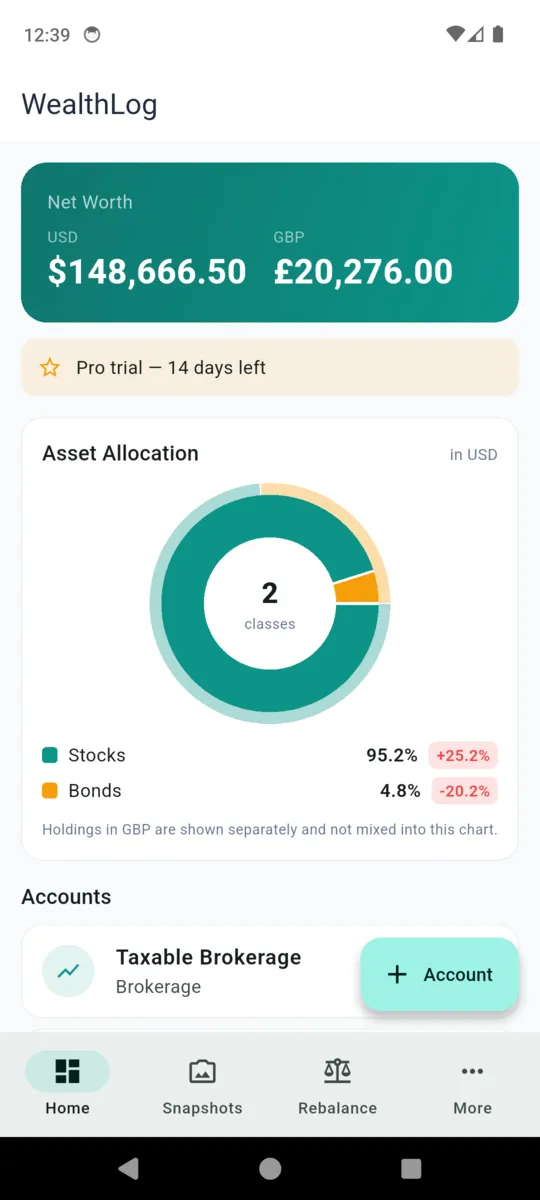
WealthLog does not convert at all. Every currency is summed on its own and shown on its own row — on the net-worth header, in the allocation chart, in every snapshot. Holdings priced in a different currency to the chart are listed separately rather than folded in.
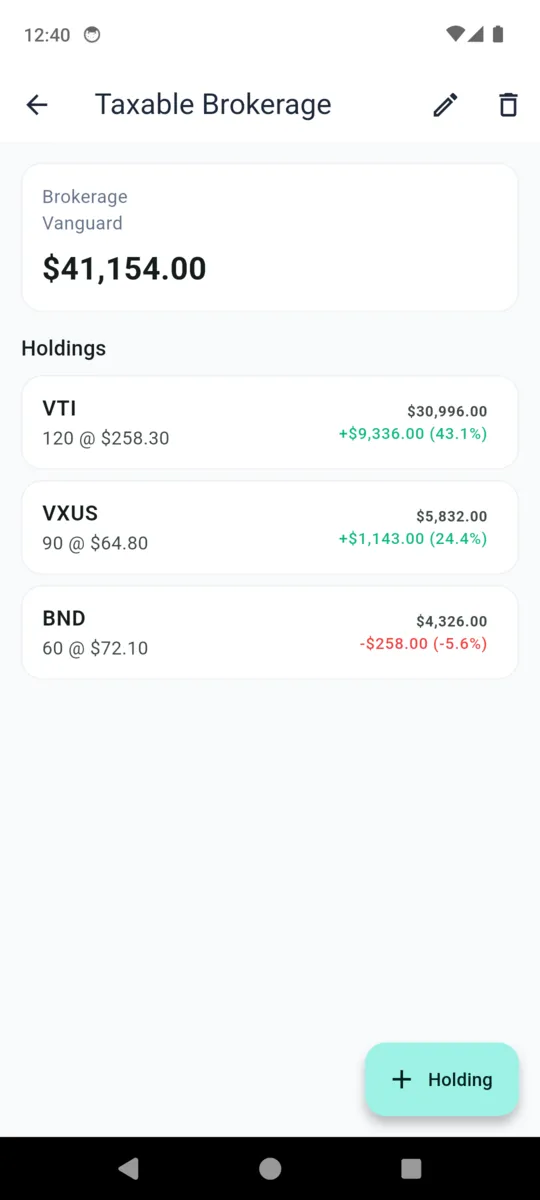
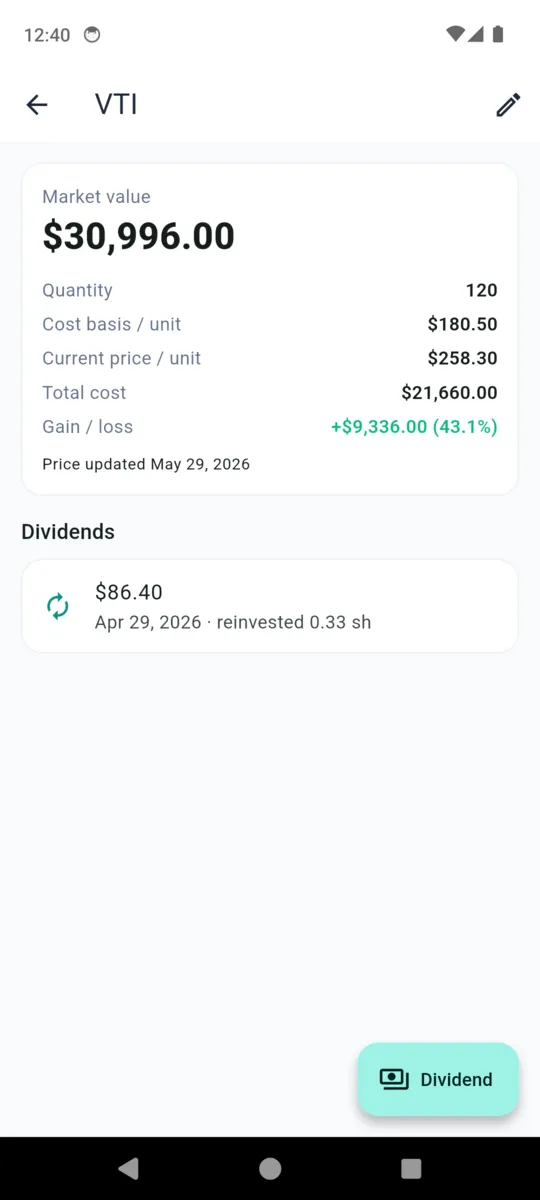
Gain and loss follow the same rule. A holding whose cost basis is in one currency and whose price is in another simply does not display a gain, because there is no honest number to display.
There is no exchange rate anywhere in the app, and so nothing to be out of date.
Net worth
- USD
- $148,666.50
- GBP
- £20,276.00
Two rows, two totals, no third number combining them. The figures above are from the sample portfolio that ships with the app.
The arithmetic is written down
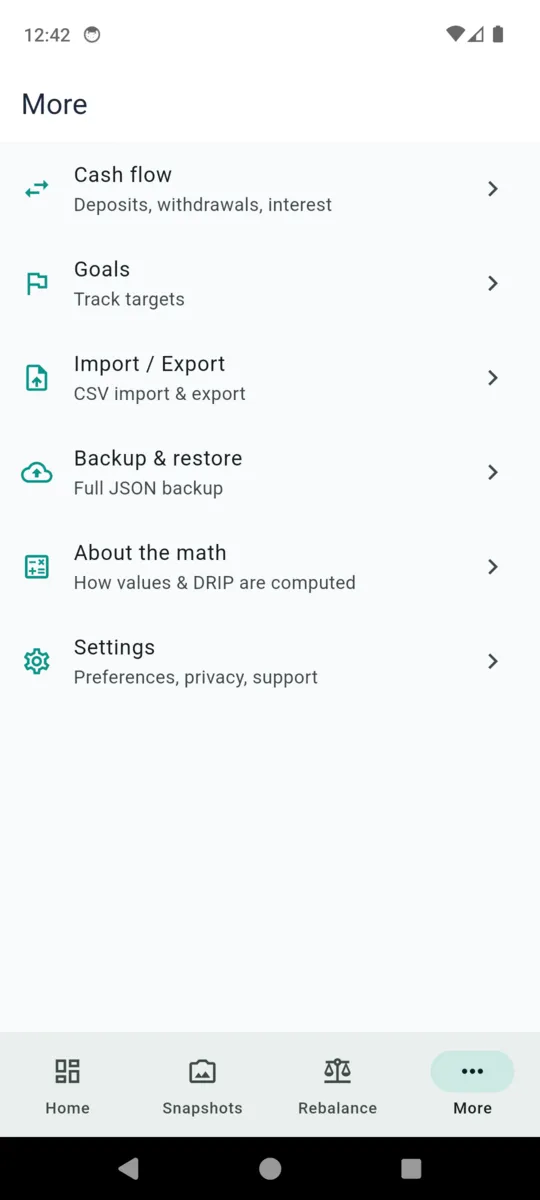
There is a screen inside the app called About the math, because a portfolio number you cannot reproduce on paper is a number you should not trust. Every figure it shows comes from one of these, computed in exact decimal rather than floating point.
- Market value
- quantity × current price per unit
- Total cost
- quantity × cost basis per unit
- Gain / loss
- market value − total cost
- Gain / loss %
- gain or loss ÷ total cost
- New cost basis after a reinvested dividend
- (old quantity × old basis + added shares × added price) ÷ (old quantity + added shares)
- Drift
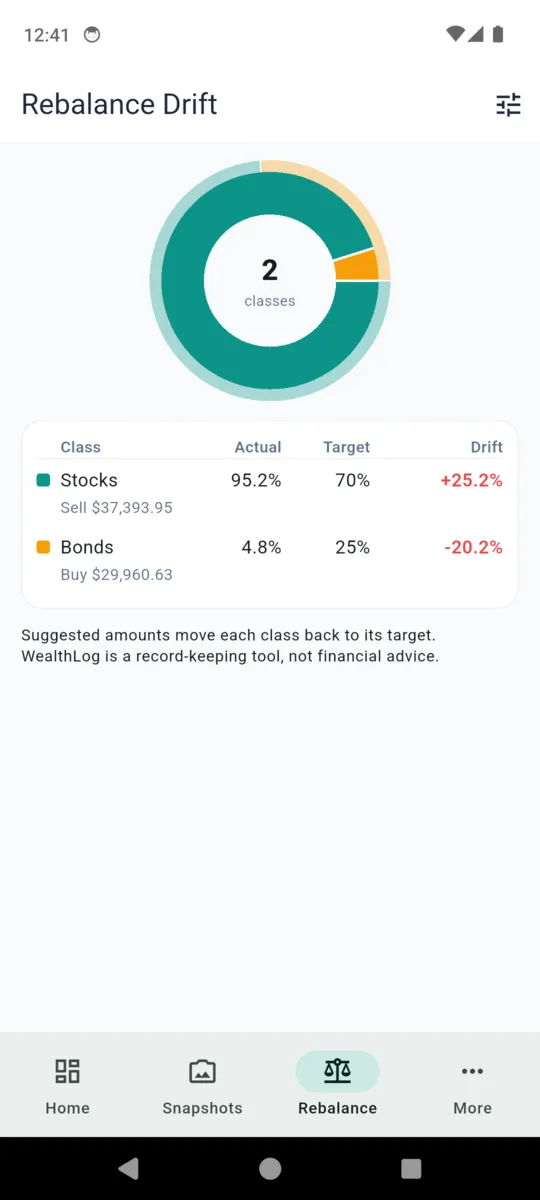
- actual allocation % − target %
Version 1 keeps a single lot per holding at average cost. Per-lot tracking — FIFO, LIFO or specific identification — is not in it, so if your tax position depends on which shares you sold, this is a record of the position rather than of the lots.
What a record looks like
Accounts hold holdings. Everything else in the app is a view over those two things or an event attached to them.
Seven account types
- Brokerage Taxable accounts, with the institution named if you want it.
- Bank / Cash Current accounts, savings, cash held aside.
- Retirement SIPP, ISA, 401k, IRA — whatever you call it, you name it yourself.
- Property A value you keep up to date by hand.
- Crypto Same record shape as anything else: quantity, cost, current price.
- Loan / Liability The one type that subtracts from net worth rather than adding to it.
- Other For the thing that fits none of the above.
What a holding carries
- Symbol or name A ticker, a fund name, a street address. Free text.
- Asset class Your own list, and it is what the allocation donut and the drift table group by.
- Quantity Exact decimal, so fractional shares are not rounded.
- Cost basis per unit With its own currency, separate from the price currency.
- Current price per unit With its own currency, and the date you last changed it.
- Notes Free text against the holding.
Cash flow
Deposits, withdrawals, dividends, fees and interest, dated and attached to an account. Deposits, dividends and interest count as money in; the other two as money out.
Dividends and DRIP
Log a dividend against a holding. If it was reinvested with new shares, the shares are added to your quantity and their price is weight-averaged into your cost basis by the formula above.
Snapshots
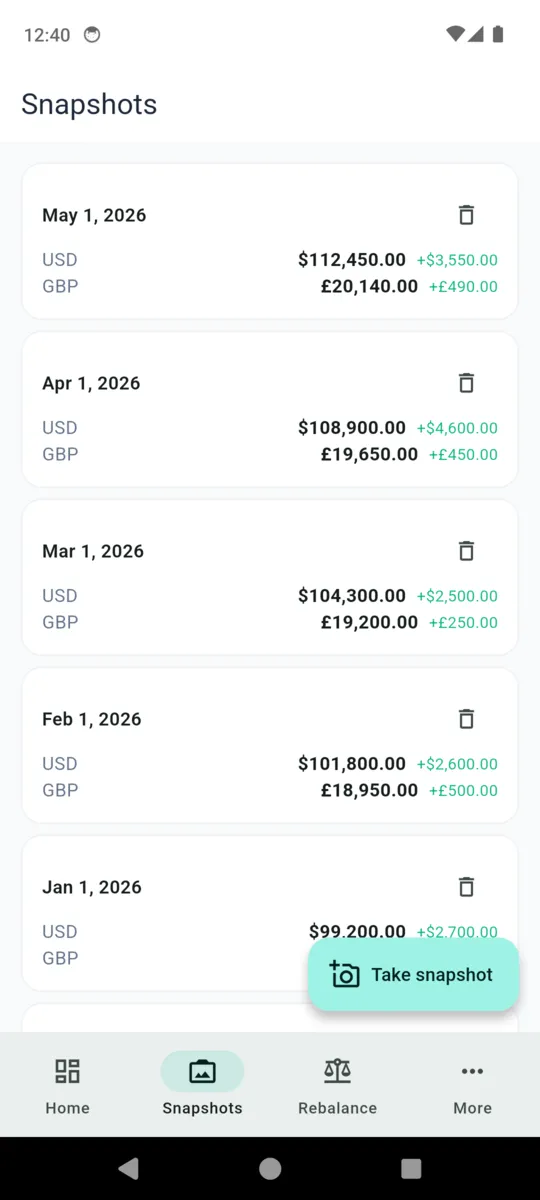
A point-in-time capture of the whole portfolio or one account, storing the totals per currency and an optional note. Taken when you tap the button — nothing takes one for you.
Goals
A name, a target amount in one currency and an optional target date. It shows how far you are from the target. It does not project when you might reach it.
What the app cannot do
- Connect to a broker or a bank
- Fetch or refresh a price
- Convert between currencies
- Send a notification of any kind
- Sync between two phones
- Produce a PDF — export is CSV and JSON
You type the prices. That is the point.
An app with a price feed needs a server, and a server needs an account, and an account means a copy of your holdings on someone else's machine. WealthLog has none of that, which is why it can honestly say your portfolio never leaves the phone.
Each holding records the date you last changed its price, so a stale figure is visible rather than hidden. Most people update on a monthly rhythm and take a snapshot at the same time, which is what the history charts are drawn from.
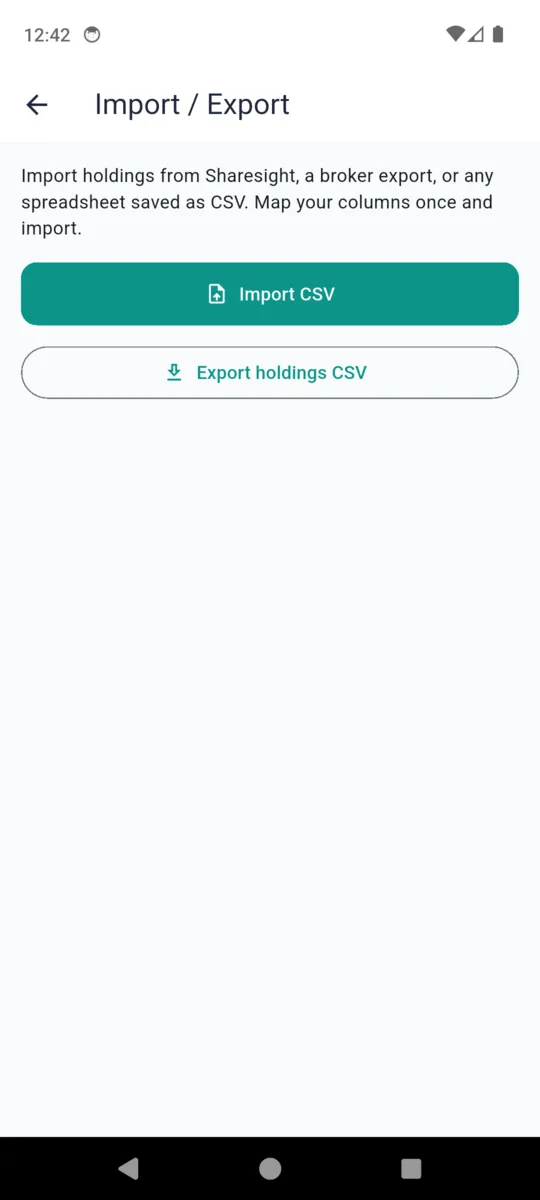
Getting started does not mean typing everything twice: CSV import reads a Sharesight export, a broker export or a spreadsheet, matches the columns it recognises and lets you map the rest.
The app itself
Every figure in these screens comes from the sample portfolio bundled with the app. They are not anyone's results and not an indication of what any investment does.
Scroll sideways, or use the arrow keys
Pricing
Everything is open for fourteen days from install, with no card and no sign-up. After that the free tier holds three accounts with five holdings each, and a banner ad appears.
- Pro adds Unlimited accounts and holdings, CSV import, and it removes the ads.
- The caps only apply to new entries Nothing you already recorded is locked, hidden or deleted when the trial ends. Read access to everything stays free.
- Backup and export are free A full JSON backup with restore, and a holdings CSV export, on every tier.
Questions
Does WealthLog tell me what to buy or sell?
No. Its own wording: a manual record-keeping tool that does not provide investment advice or recommendations, and all values are entered by you. The rebalance screen shows drift against your own targets and says the same thing underneath it.
Does it connect to my broker or fetch prices?
Neither. There is no broker link, no bank connection and no price feed. You type the current price and the app records the date you did. That is the trade-off for an app that needs no account.
How does it handle more than one currency?
It never mixes them. Net worth and allocation are shown per currency, side by side. Gain and loss on a holding appear only when its cost and its price are in the same currency, because subtracting one currency from another means nothing.
Is the money maths reliable?
It uses exact decimal arithmetic rather than floating point, so 0.1 plus 0.2 is exactly 0.3 and totals do not drift by fractions of a cent. The About the math screen inside the app sets out every formula it uses.
Can I import what I already have?
Yes. CSV import reads a Sharesight export, a broker export or a plain spreadsheet, and you map your columns once. Export runs the other way as a holdings CSV, and there is a full JSON backup and restore.
Where does my data live?
On the phone, in local storage, with no account and no sync. Nothing is uploaded. Keep the JSON backup somewhere safe, because reinstalling without one starts you from an empty portfolio.
Does it send alerts?
No. There are no notifications of any kind — no price prompts, no rebalance alerts, no reminders to take a snapshot. You open it when you want to.
What is free and what needs Pro?
The free tier holds three accounts with five holdings each. Pro removes both caps, adds CSV import, and removes the ads. Existing data is never locked or deleted when the trial ends.
Reading and reference links are on the WealthLog resources page. How the app handles your data is in the privacy policy.
Write down what you hold
Then keep it up to date on your own rhythm, on one phone, with nobody else holding a copy.