




























































































Guyton-Klinger Guardrails: Flexible Withdrawals Explained
The 4% rule assumes you never change your spending. Guardrails write the adjustment into the plan instead. Here is how the four rules actually work.

Run the numbers on a fixed 4% withdrawal and you are quietly assuming something absurd: that a retiree whose portfolio fell 40% in the first two years carries on drawing the same real income, in full, without blinking. Nobody does that. Anyone with a pulse trims something. Yet the plan on the spreadsheet says otherwise, which means the spreadsheet has been testing a person who does not exist.
Guyton-Klinger is what you get when you stop pretending and write the flinch into the plan. Instead of a fixed real withdrawal, you set trigger points above and below your starting withdrawal rate. Drift past one and spending adjusts by a defined amount. The reward for accepting those adjustments is that you can start higher than 4%.
The four rules, without the jargon
Jonathan Guyton published the first version in 2004 and refined it with William Klinger in 2006. Four rules do the work, and only two of them are the famous ones.
The portfolio management rule governs where the money comes from. You hold a cash reserve for near-term spending and take withdrawals from cash or fixed income after a losing year rather than selling equities into a fall. This is the rule everyone skips when they describe the strategy, and it is arguably the one doing the most quiet good, because it stops you from crystallising losses to fund next year’s groceries.
The withdrawal rule handles inflation. In a normal year your spending rises with inflation. In the year after a negative portfolio return, it does not. You take the same nominal amount as last year, which is a real cut of whatever inflation happened to be. There is no catch-up afterwards: that increase is gone, not deferred. One important qualifier, often lost in summaries, is that the freeze only applies while your current withdrawal rate sits above your initial rate. If your portfolio has grown enough that you are drawing less proportionally than when you started, a down year does not freeze you.
The capital preservation rule is the lower guardrail. If your current withdrawal rate climbs to 20% above your initial rate, you cut spending by 10%. Start at 5% and your trigger is 6%. This rule is switched off in the final fifteen years of the plan.
The prosperity rule is the upper guardrail and works in mirror image. If your withdrawal rate falls to 20% below the initial rate, you raise spending by 10%. Start at 5% and a drop below 4% earns you a raise.
That is the entire machine. Two boundaries, a 10% step at each, plus the inflation freeze and a sensible sourcing policy.
What the guardrails look like at your starting rate
Your current withdrawal rate is this year’s planned spending divided by the portfolio’s value today. The guardrails are just that starting number multiplied by 1.2 and 0.8.
| Initial rate | Cut triggers above | Raise triggers below |
|---|---|---|
| 4.0% | 4.8% | 3.2% |
| 4.5% | 5.4% | 3.6% |
| 5.0% | 6.0% | 4.0% |
| 5.5% | 6.6% | 4.4% |
| 6.0% | 7.2% | 4.8% |
Notice what the arithmetic implies about the portfolio. At a 5% start, the lower guardrail is hit when the portfolio has fallen far enough that your unchanged spending now represents 6% of it, which is roughly a 17% decline after allowing for the inflation adjustments along the way. That is not a crisis-level fall. It is an ordinary bad year, and the rules will ask you for a cut.
A worked example through an ugly start
Say you retire with £800,000 and a 5% initial rate, so £40,000 in year one. Guardrails sit at 6% and 4%.
Year one ends badly. Markets drop and the portfolio finishes at £660,000. Inflation ran at 3%, but because the year was negative, the withdrawal rule freezes you at £40,000 rather than £41,200. Check the guardrail: £40,000 against £660,000 is 6.06%, just past the 6% line. The capital preservation rule fires and you cut 10%, to £36,000.
Year two is flat. The portfolio ends around £625,000 after your withdrawal. Inflation was 3% again, but the previous year was not negative, so you do get the increase: £37,080. That is 5.9% of the portfolio, inside the band, so nothing else triggers.
Year three the market recovers hard and you finish at £790,000. Your spending indexes up to £38,192, which is 4.8% of the portfolio. Still inside the band, so no raise. You do not get an automatic return to £40,000 when markets recover. You return only when the portfolio grows enough for your reduced spending to fall below 4% of it, and from £38,192 that needs a portfolio above £955,000.
That asymmetry is the part most descriptions gloss over, and it is worth sitting with. In real terms you came out of a single bad year permanently poorer until markets are meaningfully higher than where you started. The strategy is not a thermostat that returns you to a set point. It is a ratchet in both directions, with a wide dead zone in the middle.
Where people go wrong with it

The cut is 10% of current spending, and cuts compound. Two triggers in a bad sequence leave you at 81% of your original income, three at 73%. People model one cut, decide they could live with £4,000 less a year, and never check the second one. Run the sequence properly before you rely on it.
The higher starting rate is not from cleverness. Guyton and Klinger’s work supported starting rates in the low-to-mid 5% range over 40 years, against roughly 4% fixed. That extra income is purchased with your willingness to accept cuts, and if you would not actually take the cut, you have simply started at 5.4% with no plan. The strategy’s success rate belongs to the person who follows it, not the person who admires it.
The fifteen-year cutoff surprises people. Capital preservation stops applying in the last fifteen years of the planning horizon, so if you have planned to 95, the lower guardrail stops protecting you at 80. The logic is that outliving the money matters less as the horizon shortens. Whether that logic fits you depends on whether your late-life spending is care costs you cannot compress.
The research was run on US market history with equity allocations of 50%, 65% and 80%. A portfolio heavily weighted to a different market, or one holding a large cash position, is not the thing that was tested. The rules will still function. The starting rate that came out of the backtest will not necessarily travel.
And the last one, which is more psychological than mathematical: a guardrail hit is a moment you have to act. It arrives during a market fall, when every instinct says wait and see. A rule you abandon at the exact moment it triggers is worse than a fixed withdrawal, because you spent the intervening years drawing more on the strength of a promise you did not keep.
When a fixed real withdrawal is still the better answer
If most of your spending is genuinely non-negotiable, guardrails are the wrong shape. Someone whose budget is mortgage, care costs and food has no 10% to give, and pretending otherwise on a spreadsheet does not create flexibility that does not exist. The honest move there is a lower fixed withdrawal, or a guaranteed income floor covering the essentials with a flexible strategy running on the discretionary layer above it.
The useful test is not “would I cut 10%?” in the abstract. It is: name the £4,000 of annual spending you would remove, this year, and check that removing it twice still leaves a life you want. If you can point at it, guardrails will work for you. If you cannot, the flexibility is fictional and the higher starting rate is borrowing against a repayment you have not budgeted.
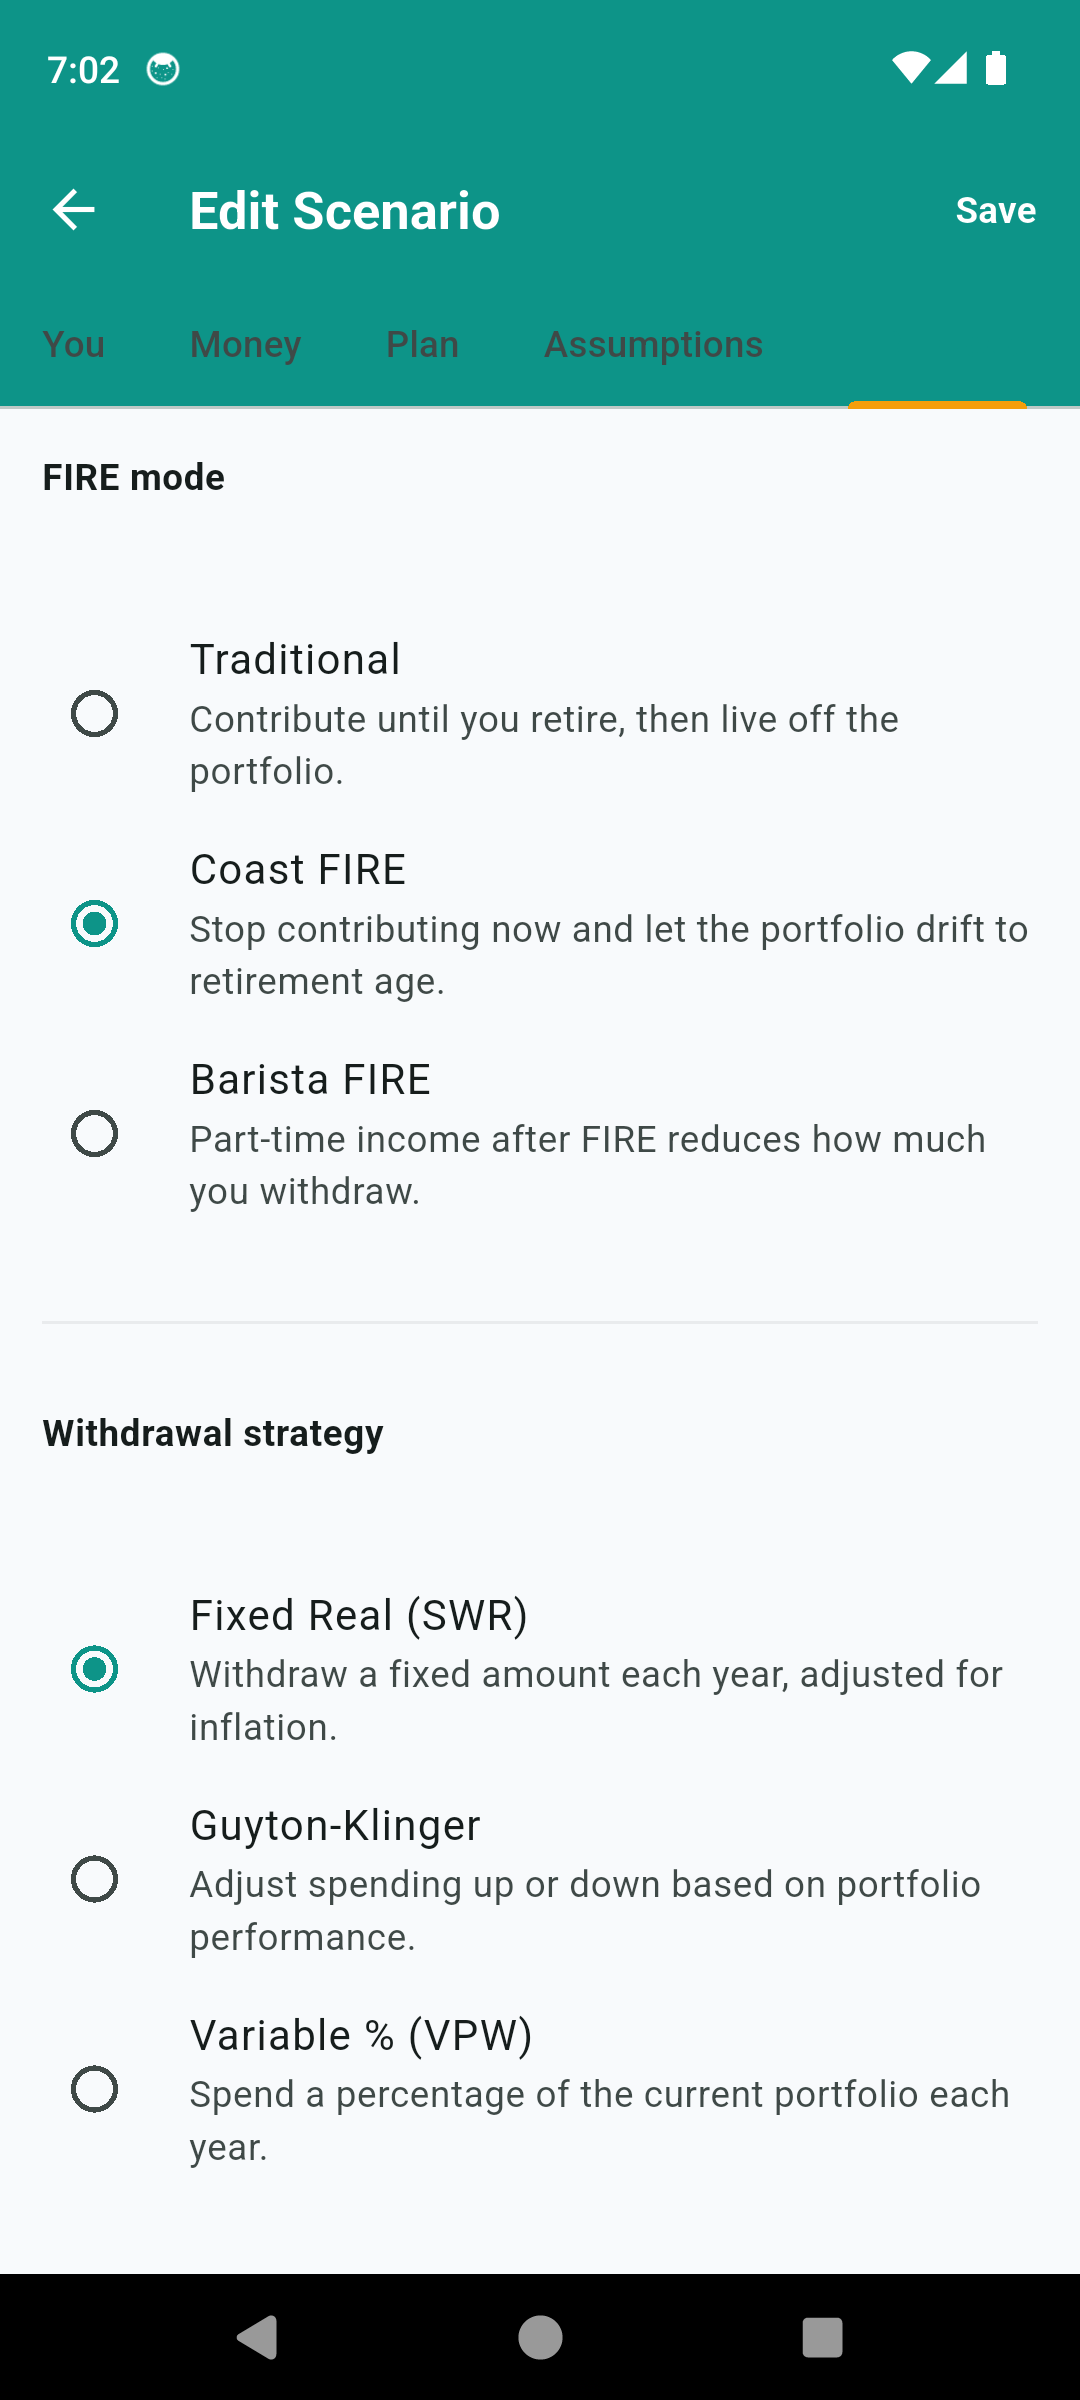
Modelling it by hand is tedious, because the interesting question is not what happens on average but what happens across hundreds of different return orderings, and how deep the cuts go in the bad ones. Running the same plan under a fixed withdrawal and under guardrails, then comparing the worst decile of outcomes for each, tells you more than any single projection. FireCalc will run both against the same simulation set so the comparison is like for like, which is also where a look at sequence of returns risk becomes concrete rather than theoretical.
What guardrails really give you is not a higher withdrawal rate. It is a decision made in advance, in a calm room, about what you will do when the number goes the wrong way. That is worth having even if you never touch the 5% start.
This is general information, not financial advice. Withdrawal strategies depend on your own circumstances, tax position and risk tolerance, and the research behind these rules is based on historical market data that may not repeat. Speak to a regulated financial adviser before making retirement decisions.
Common questions
What withdrawal rate can you start with using guardrails?
Guyton and Klinger's 2006 research supported initial rates in the low-to-mid 5% range over a 40-year horizon, against 4% for a fixed withdrawal. That headroom is bought entirely with your willingness to cut spending later, and it was measured against US market history, so treat it as a ceiling rather than a target.
How big are the spending cuts?
Each trigger is a 10% reduction in your current spending, not a reset to some floor. Two cuts in consecutive bad years leave you on 81% of where you started, and there is no automatic path back up other than the prosperity rule firing later.
Is Guyton-Klinger the same thing as guardrails?
Not quite. Guyton-Klinger is one specific rule set from 2006. 'Guardrails' has since become a general label for any strategy with upper and lower spending triggers, including probability-based versions that recalculate a plan's success rate rather than watching the withdrawal rate itself.
Do the rules ever stop applying?
Yes. The capital preservation rule switches off in the final fifteen years of the plan, on the reasoning that a 90-year-old overspending slightly matters less than a 60-year-old doing it. The prosperity rule keeps running throughout.