






















































































































































Sequence of Returns Risk: Why When You Retire Matters as Much as How Much
Two retirees with identical average returns can finish six figures apart. Here is the mechanism behind sequence risk, and what actually reduces it.

Two people retire on the same day with a million each and the same plan: take fifty thousand a year, leave the rest invested. Over their first five years they get exactly the same five annual returns. Same numbers, same average, drawn from the same hat. One finishes year five with £778,275. The other finishes with £907,750.
The only difference is the order the returns arrived in.
| Year | Bad start | Balance | Good start | Balance |
|---|---|---|---|---|
| 1 | −20% | £760,000 | +20% | £1,140,000 |
| 2 | −15% | £603,500 | +25% | £1,362,500 |
| 3 | +10% | £608,850 | +10% | £1,443,750 |
| 4 | +25% | £698,563 | −15% | £1,184,688 |
| 5 | +20% | £778,275 | −20% | £907,750 |
Run those same five years with no withdrawals at all and both portfolios land on exactly £1,122,000. Identical, to the pound. The gap only opens because money is leaving while the market is down.
That is sequence of returns risk in one line. When nothing is being withdrawn, the order of returns is cosmetic. When you are selling, the order becomes the thing that decides your outcome.
Why withdrawing turns order into destiny
Multiplying a set of returns together gives the same answer whichever order you do it in. That is why the no-withdrawal case ties exactly. Withdrawals break that symmetry, because you are subtracting a fixed sum from portfolios of very different sizes.
The clearest way to see it is in units rather than pounds. Taking £50,000 out of an untouched million means selling 5% of your holdings. Taking the same £50,000 after a 20% fall means selling 6.6% of what is left. You have sold a third more of your actual shares to fund the same year of living, and those extra shares are gone. They do not participate in the recovery, they never pay another dividend, and no subsequent bull market brings them back.
This is why “the market always recovers” is true and irrelevant at the same time. The index recovers. Your portfolio recovers a smaller number of units than it started with, and that shortfall compounds quietly for the next twenty-five years.
The same mechanism runs in reverse while you are still saving. A bad first decade of contributions is a gift, because every payment buys more units at depressed prices, and the strong years arrive later when the portfolio is large enough for them to matter. A 30-year-old and a 62-year-old should feel genuinely different about the same bear market, and most people are trained to feel the same way about both.
The window where it actually bites
The dangerous period is not all of retirement. It is roughly the five years before your finish date through the first ten after, sometimes called the retirement red zone. Two things line up there. Your portfolio is at its largest, so a given percentage fall costs the most in absolute terms, and withdrawals have just started, so the fall is being crystallised rather than ridden out.
Work through the arithmetic on a 30-year retirement and the first ten to fifteen years do nearly all the work in deciding whether the money lasts. Get a decent real return in that window and almost nothing later can sink you, because by then you are drawing a modest percentage of a portfolio that has grown well clear of your spending. Get a poor one and no amount of good luck at year twenty repairs it.
1966, not 1929
Ask people to name the worst year to have retired and most say 1929. In the US historical record it was 1966.
William Bengen’s 1994 study, the paper that produced the 4% rule, tested every rolling 30-year retirement starting from 1926 and looked for the highest fixed inflation-adjusted withdrawal rate that survived even the worst of them. He called it SAFEMAX and landed on about 4.15%. The cohort that set that floor started in the mid-1960s.
The reason is instructive. After the 1929 crash the fall was brutal but deflation meant the retiree’s inflation-linked withdrawal shrank in cash terms, and the recovery, when it came, was strong. From 1966 the market ground sideways in nominal terms for about sixteen years while inflation ran hot enough to roughly triple the cost of living. A withdrawal that started at £40,000 was demanding well over £100,000 by the early eighties, against a portfolio that had gone nowhere. No crash headline, no single terrible day, just a slow squeeze from both ends.
The lesson worth carrying: sequence risk is not only about crashes. A long flat stretch paired with inflation is more dangerous to a retiree than a sharp fall followed by a fast rebound.
What actually reduces it
Ranked by how much they do, rather than how often they get discussed.
Spending flexibility is far and away the biggest lever, and it is the cheapest. A retiree who can trim withdrawals modestly in bad years survives sequences that break a retiree taking a rigid inflation-linked amount forever. It does not take heroics. Simply skipping the inflation increase in a year the portfolio has fallen, then resuming it later, removes a surprising amount of the risk. Formal versions of this exist, like the Guyton-Klinger guardrails, which cut spending when the withdrawal rate drifts above a ceiling and raise it when it falls below a floor.
Not retiring on a fixed date is the next one. A year or two of part-time income at the start is worth several times the same money earned later, because it is money you do not have to sell units to raise during exactly the window where selling hurts most. If you are near your number and the market has just fallen 25%, delaying by a year is one of the strongest moves available.

Then the asset allocation ideas. The bond tent, popularised by Michael Kitces and Wade Pfau, means glidepathing into bonds as you approach the finish line and then back into equities over the first decade of retirement. Their 2014 work found that rising equity glidepaths did better than the conventional declining ones, with optimal starting equity around 20% to 40% climbing to 40% to 80%. It is a real effect but a marginal one next to flexibility, it is still argued over, and it demands the discipline to buy equities in the year you least want to.
A cash buffer of one to two years of spending is worth holding, though be honest about why. The research on whether bucket strategies beat plain total-return rebalancing is genuinely mixed. The value is mostly behavioural: someone with two years of spending in cash is much less likely to panic-sell at the bottom, and avoiding that is worth more than any allocation tweak.
What does not help: trying to predict the sequence, sitting in cash waiting for clarity, or optimising fund fees to the third decimal place while keeping a spending plan with no give in it.
Seeing it in your own numbers
An average return is the wrong tool for this question. Multiplying your pot by 7% a year in a spreadsheet produces a smooth line that no retirement has ever followed, and it hides the entire problem.
Two approaches show it properly. Historical cohort testing runs your plan through every actual start year in the record, so 1966 and 1929 and 2000 are all in there with their real inflation attached. Monte Carlo generates thousands of random paths instead. Run both, because they fail differently: a naive Monte Carlo that draws each year independently tends to understate sequence risk, since real markets produce sustained regimes rather than fresh coin flips every January.
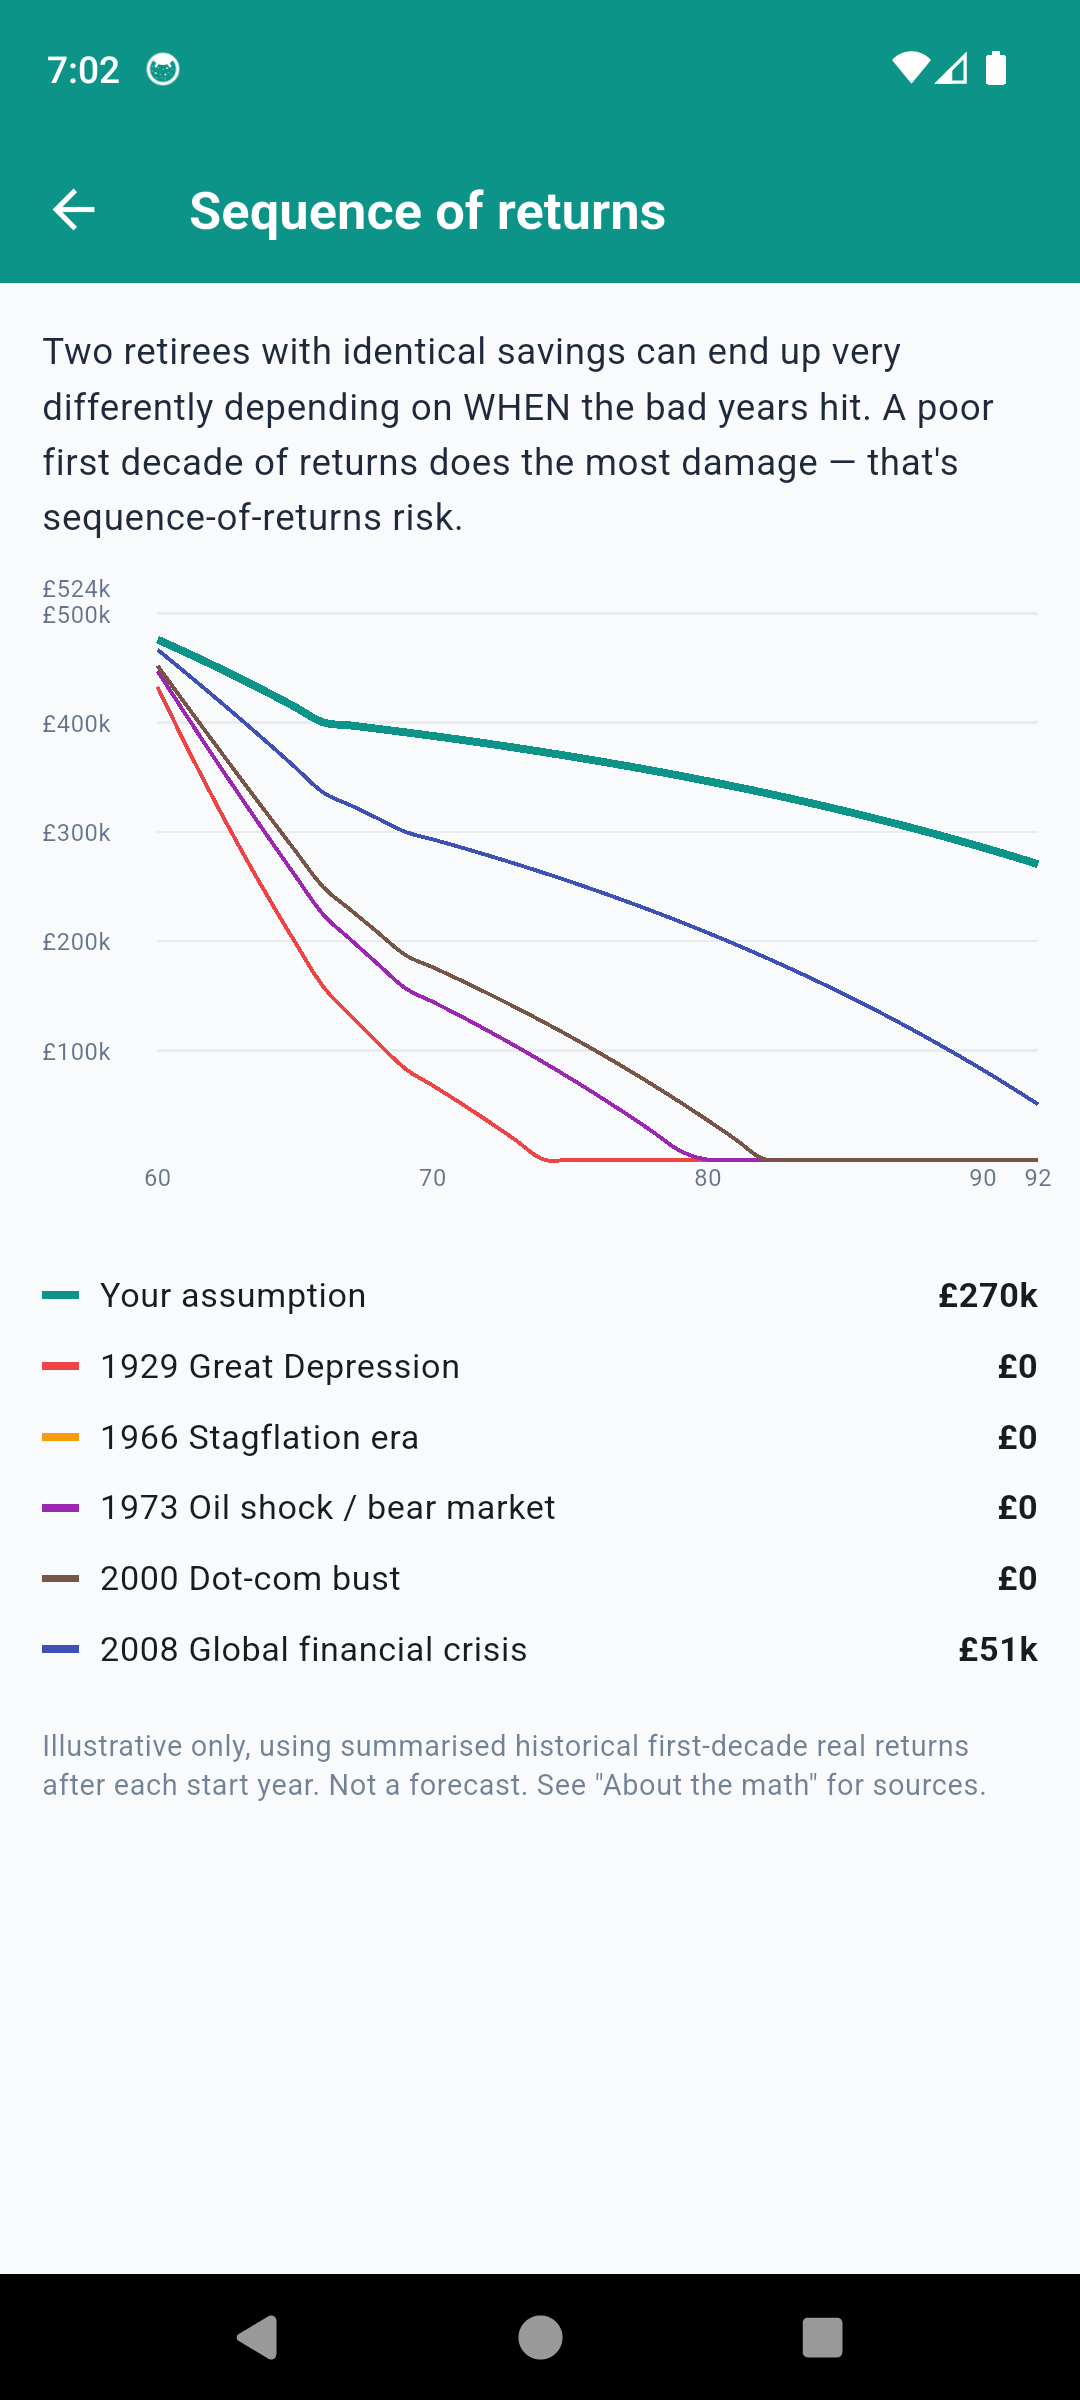
FireCalc does both and shows the cohort spread rather than a single line, which is the point: what you want to know is not what happens on average, but how bad the bad version looks and whether you could live with it. If you have not settled on a withdrawal rate yet, the companion piece on the 4% rule covers where that number comes from and where it stops applying.
The practical conclusion is not to fear retiring. It is that two plans with identical expected returns can carry very different amounts of risk, and the one with some give in the spending is the one that survives a 1966.
This is general information, not personal financial advice. Withdrawal strategy depends on your own circumstances, tax position and country, so check anything here with a regulated adviser before acting on it.
Common questions
What is sequence of returns risk in simple terms?
It is the risk that a run of poor returns lands in the first few years of retirement rather than later. The average return over your whole retirement can be identical either way, but if you are withdrawing money, an early downturn forces you to sell more units at low prices and those units are not there for the recovery.
Does sequence risk affect me while I am still saving?
It works in your favour then. If you are contributing rather than withdrawing, an early crash lets you buy at lower prices, and a strong run late in your career lifts a portfolio that is already large. The risk only flips against you once money starts leaving.
What was the worst year to start retirement?
In US historical data it was 1966, not 1929. From 1966 the market went roughly sideways in nominal terms for sixteen years while inflation raised the cost of living sharply, so an inflation-linked withdrawal grew against a portfolio that was not growing.
How long does sequence risk stay dangerous?
Roughly the first decade. Analysis of 30-year retirements shows outcomes are driven overwhelmingly by real returns in the first ten to fifteen years. After that the portfolio has either survived the danger zone or the trajectory is already set.